Published Wednesday, June 6, 2018 7:00AM EDT
Rupen Seoni is Senior Vice President and Practice Leader at Environics Analytics. This is the third in a series of blogs leading up to the provincial election that will look at voter segments their party preferences and key ridings.
Whichever way Peterborough-Kawartha votes, so goes the election—at least that’s been the case for the past 40 years. So the question everyone is asking is which way will this riding vote in on June 7? Its demographic makeup may offer some clues.
While the province has millions of different voices, our analysis shows that there are seven prominent segments, or voter groups, who tend to decide the outcome of an election: Urban Affluence, Orange Heartland, Red Core, Blue Ontario, Boomer Battleground, Multicultural Families and Young & Urban. (You can find a more detailed summary of the key voter segments, here.)
By looking at this riding through a demographic lens we can see that Peterborough-Kawartha is home to a large number Blue Ontario voters. And yet despite being this high number of right-leaning voters, this riding voted overwhelmingly Liberal in the 2014 provincial election, with Kathleen Wynne’s party securing just over 45% of the vote. But with the Liberals looking at distant third in this election, where will that support go on Thursday?
The Ontario Progressive Conservatives were the runner-up in this riding in 2014, claiming almost a third of the vote. Given Blue Ontario voters account for almost half of the population in this riding, paired with their high propensity to turn up at the ballot box, an argument could be made that many of the voters could flip to the PC this time around.
If the NDP are not able to win over these Blue Ontario voters, then their next best shot would be with the Boomer Battleground segment—the next largest segment in this riding—but it’s an uphill battle. While this group—which is made up of older singles and couples with modest incomes—tends to be more fickle when they cast their ballot, they still named the PCs their second choice ahead of the NDP.
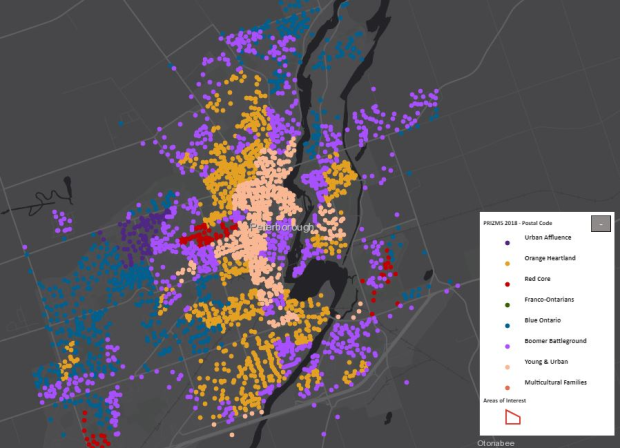
An overview of the key voter segments in the bellwether riding of Peterborough-Kawartha (Source: Environics Analytics)
Doug Ford, however, is the wild card in our analysis. If there is a lot of strategic voting it could be anyone’s race, but by looking at the riding through this lens we have a better sense of how this riding could vote.
Of course, this is just one seat. Using this same approach, here is a look at some of the other key ridings to watch in the upcoming election:
BRAMPTON RIDINGS (Five ridings: Brampton East, Brampton Centre, Brampton North, Brampton West, Brampton South)
Key Dynamics:
• 60% Multicultural Families (especially South Asians) – voted Liberal in 2014, but NDP had the next most support
• 26% Red Core – voted Liberal, but the Ontario PCs were their second choice
Brampton has many highly multicultural ridings, with several large South Asian enclaves. The riding of Brampton East voted strongly NDP in 2014, but the other four ridings went Liberal. Assuming the NDP hangs on to that riding, the other four ridings (Brampton Centre, Brampton North, Brampton West, Brampton South) could be in play for the NDP or PCs.
Who stands to gain the most? These voters went Liberal in 2014, but they showed a preference for NDP over PC as their second choice. In Brampton, I’d expect the NDP to receive more of the disgruntled Liberal vote.
MISSISSAUGA RIDINGS (Six ridings: Mississauga Centre, Mississauga East-Cooksville, Mississauga-Erin Mills, Mississauga-Lakeshore, Mississauga-Malton, Mississauga-Streetsville)
Key Dynamics:
• 47% Red Core – voted Liberal with PC as second choice
• 34% Multicultural Families (heavily South Asian, but some East Asian/Chinese too) – voted Liberal with PC as second choice, with the exception of Mississauga-Malton, which went NDP orange.
• 14% Urban Affluence – voted Liberal with PC as second choice.
The Liberals did very well in 2014 in the Mississauga ridings. Looking at a cross section of the segments, the more affluent segments tended to vote PC as their second choice, while less affluent voted NDP. South Asians are an important force in Mississauga and their voting patterns conform to this as well: the more affluent South Asian segment voted PC as their second choice, while the less affluent segments voted NDP. There are other cultural groups present, of course, but this divide along the lines of affluence shows up with those groups, too.
Who stands to gain the most? I expect the PCs to make some significant gains in Mississauga, but the NDP to gain ground in Mississauga-Malton.
MARKHAM & SCARBOROUGH-AGINCOURT RIDINGS (Four ridings: Markham-Stouffville, Markham-Thornhill, Markham-Unionville, Scarborough-Agincourt)
Key Dynamics:
• 65% Multicultural Families (heavily Chinese/East Asian with some South Asians) – voted Liberal with PC as the clear second choice
• 18% Red Core – voted Liberal with PC as second choice
• 12% Urban Affluence – voted Liberal with PC as second choice
Markham and Agincourt has a very strong, affluent Chinese & East Asian character with some South Asians present. This area of the GTA was clear and consistent in its voting patterns in 2014: they voted Liberal, but their second choice was PC—and the PCs did fairly well, picking up nearly 36% of the vote in these ridings.
Who stands to gain the most? The NDP was in distant third place. I anticipate these ridings will lean towards the PC.
SCARBOROUGH RIDINGS (Five ridings: Scarborough, North, Scarborough Centre, Scarborough-Guildwood, Scarborough-Rouge Park, Scarborough Southwest)
Key Dynamics:
• 47% Red Core – a key Liberal-voting segment in 2014 whose second choice was PC
• 39% Multicultural Families (mainly South Asian with some Filipinos and Black populations; Chinese in Scarborough North) – voted Liberal with NDP as second choice
There is different potential for the PCs or NDP to make gains depending on the riding in Scarborough. And that difference hinges on the make-up of the Multicultural Families segment. In some three ridings, it’s heavily South Asian; in two ridings it’s more Chinese and East Asian. As we noted earlier, these groups tend to have different second-favourite parties who we’d expect to pick up the lion’s share of votes that shift away from the Liberals.
Who stands to gain the most? The NDP could make in-roads in Scarborough Southwest, Scarborough Centre, Scarborough-Rouge Park, while the PCs could see gains in Scarborough North, Scarborough Guildwood
NORTH TORONTO RIDINGS (Six ridings: York Centre, Eglinton-Lawrence, Willowdale, Don Valley North, Don Valley West, Don Valley East)
Key Dynamics:
• 34% Multicultural Families (mostly affluent to middle-income Chinese/East Asian, plus some newcomers) – strongly Liberal voters in 2014 with PC second; NDP distant third
• 28% Urban Affluence – Liberal with PC a close second
• 27% Red Core – strongly Liberal with PC second
All of these ridings were decisively Liberal in 2014, but nearly all voter segments (except the Newcomer portion of the Multicultural Families) chose the PCs as their second choice. The NDP had a very small share of voters. Don Valley West is Kathleen Wynne’s riding.
Who stands to gain the most? I’d expect a definite shift to the PCs in all of these ridings, but how strongly will determine whether the Liberals can hang on to any of them.
DURHAM
Key Dynamics:
• 57% Blue Ontario – the Liberals just beat the PCs in 2014 in what we’d typically expect to be PC voters
• 14% Red Ontario – the NDP just beat out the Liberals with support from voter we’d typically expect to vote for the Liberal
• 17% Boomer Battleground – the Liberals won this segment, but only by a hair over the PCs and the NDP was just behind the PCs. Only 1.5 percentage points separated all three parties
Durham was a very close race in 2014, and voters in this riding cast their ballots somewhat atypically for the demographics: this riding seemed to vote more to the left than we’d expect, giving the Liberals a victory.
Who stands to gain the most? With the Liberals losing votes, since most voters “look” more like PC supporters, I expect the shift to be towards the Tories in Durham.
KITCHENER CENTRE
Key Dynamics:
• 33% Boomer Battleground – were strongly Liberal with PC and NDP well behind, but neither clearly ahead
• 25% Young & Urban – Liberal also with NDP clearly second choice over PC
• 15% Red Core – Liberal with both PC and NDP well behind, but neither had a clear advantage
• 13% Orange Heartland – Liberal in this riding with NDP as the clear second choice
This is a complex riding with every voter segment present. The PC and NDP fought closely for second place in 2014 in many voter segments.
Who stands to gain the most? It’s tough to call who has the advantage with so many offsetting forces among different voter segments, but the NDP probably has a bit of an edge.
GUELPH
Key Dynamics:
• 30% Boomer Battleground – Liberal voters in 2014 with Greens in second, edging out the PCs
• 23% Red Core – Liberal with PC in second
• 14% Blue Ontario – Liberal with PC in second; Greens beat out the NDP
• 10% Orange Heartland – Liberal first with the Greens capturing 24% of votes, ahead of the NDP
A complex riding with all voter segments present, made more complex by the strength of the Green Party, which is unparalleled elsewhere. To put that in context, the Green Party took second place among three segments that represent over half of all votes cast. They were the second choice (barely) among the Boomer Battleground whose vote is often a three-way split. They also were second with Young & Urban and Orange Heartland voters, in each case ahead of the NDP which was the next choice.
Who stands to gain the most? Other large segments (Red Core, Blue Ontario, Urban Affluence) all chose the PCs as their second choice, giving the PCs the second spot overall in the riding but it was close, so I’m going to go out on a Green Party limb and calling the Greens as having the advantage.
LONDON NORTH CENTRE
Key Dynamics:
• 31% Young & Urban – chose the NDP over the Liberals by almost 3%
• 25% Red Core – strongly Liberal with PC second
• 19% Boomer Battleground – NDP was their favourite
This is a complex riding with all voter segments and a large student population present. The segments had very different party preferences which means this riding is one that has the potential to swing. The Liberals won with 36% in 2014, with the NDP at 30% and PC at 26%.
Who stands to gain the most? On balance, the large young population—despite their low turnout rate—gives the advantage to the NDP.
ST. CATHARINES
Key Dynamics:
• 41% Boomer Battleground – usually a segment where the vote is close, but they solidly Liberal with PC as the clear second choice
• 24% Orange Heartland – Liberals led in 2014, with the NDP second
• 15% Blue Ontario
This has been a Liberal riding with high-profile cabinet minister Jim Bradley holding it for over 40 years. All segments voted Liberal in 2014. The PCs were in second place in all segments but Orange Heartland and Young & Urban which, together, cover about one-third of the votes cast in the last election. If the electorate abandons the Liberals here, the natural tendency would be for the PCs to have the edge, but two nearby ridings—Niagara Centre and Niagara Falls—have similar voter make-up as St. Catharines and both of them are NDP.
Who stands to gain the most? This one is hard to call, but I think both NDP and PCs will make significant gains; but who takes it over the top is hard to call.
OTTAWA CENTRE
Key Dynamics:
• 61% Young & Urban – voted Liberal with NDP a very distant second
• 23% Red Core – voted Liberal with PC a very distant second
The question in Ottawa Centre is whether the Liberals will hang on, or will the seat go to the NDP. The Liberals had such a commanding lead in 2014 (51.4% to 20.2% for the NDP), the shift to the NDP would have to be about 15 points from the Liberals for them to win. Given the polls, this is possible. The young vote here would tend to the NDP naturally.
Who stands to gain the most? With Attorney-General, Yasir Naqvi as the incumbent, the Liberals might just hang on.
THUNDER BAY RIDINGS (Two ridings: Thunder Bay—Atikokan, Thunder Bay—Superior North)
Key Dynamics:
• 29% Boomer Battleground – voted Liberal with NDP in second
• 29% Blue Ontario – voted Liberal with NDP in second, but PCs had the strongest showing of all voter segments
• 23% Orange Heartland – voted Liberal with NDP in second; this segment gave them their strongest vote share as would be expected
Thunder Bay ridings went very strongly Liberal in 2014, but with the NDP solidly in second place for very voter segment, I’d expect the NDP to pick up the lion’s share of the Liberals’ vote that changes allegiance.
Who stands to gain the most? Even if the Blue Ontario voters swing heavily to the PCs, there aren’t enough of them to offset the Orange Heartland and Boomer Battleground voters who would probably swing NDP.
- What PRIZM5 segment do you belong to? http://www.environicsanalytics.ca/PRIZM5
Rupen Seoni is Senior Vice President and Practice Leader at Environics Analytics. He provided commentary on voter segments and demographics in CTV’s federal election coverage and will be part of CTV’s provincial election night coverage on June 7. This is the third in a series of blogs leading up to the provincial election that will look at voter segments their party preferences and key ridings.
[“Source-ctvnews”]


